You can create your own datasheet report with customized data fields that can be downloaded as a CSV format. This is a good option for student level data. Click the “Pick a Column” link, then the “>” button to move them to right panel. Click on the “Apply” button.


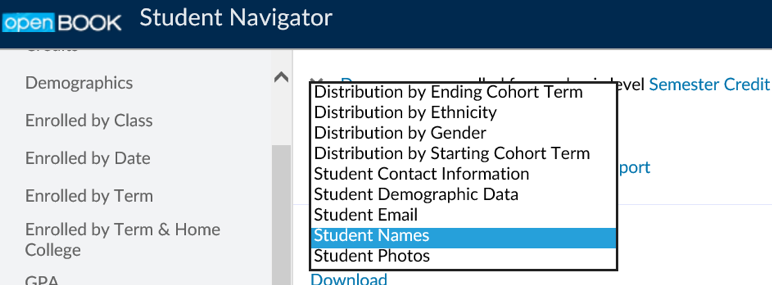
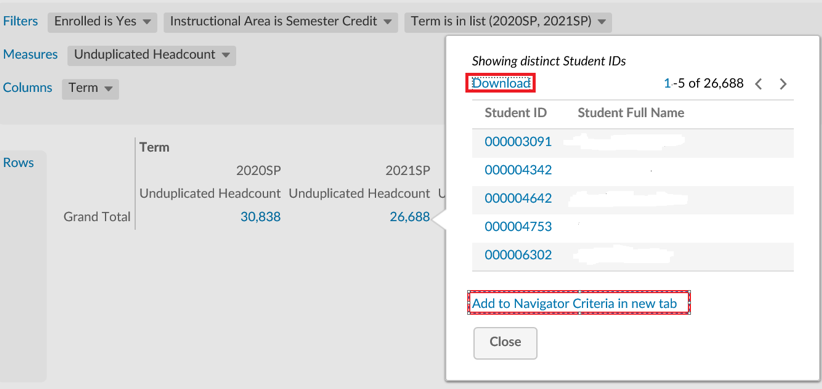
Yes, click the “Download” link.
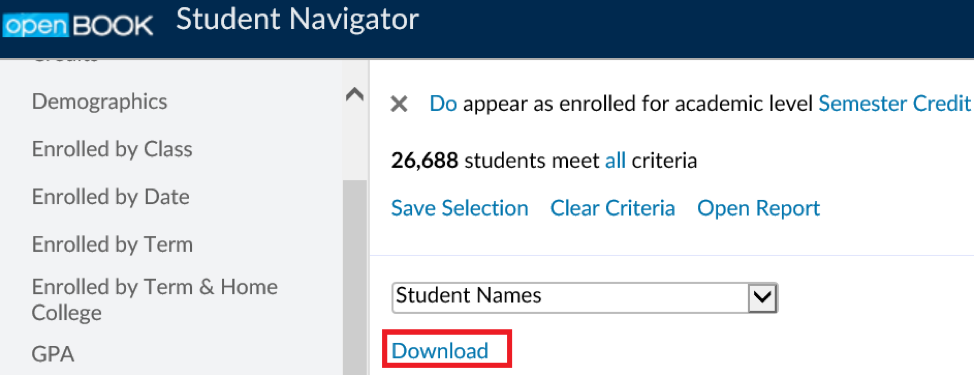
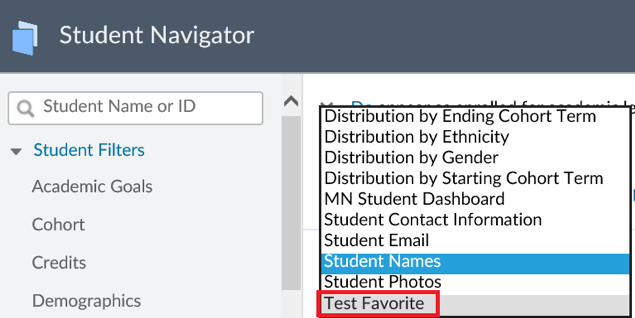
Yes, there is a list of different views in Student Navigator.
By default, No. Your saved criteria and your saved lists are specifically yours and cannot be accessed by any other users. You have an option to share it with others.
Once you’re ready to save your group of students, you can click on either the “Save as criteria” link or the “Save as list” link at the top of your group. This will allow you to name and describe this particular group of students for your later use.
Yes. In Student Navigator, you have the option to save your group of students as a “Criteria” (meaning that each time you use it in the future it will show you the current group of students who match your filters) or as a “List” (meaning that you will save the current displayed list of students even if they later do not match your selected filters).
Once you’ve finished applying filters and have identified your group of students, click the “Open Report” link at the top of the page in order to see a list of selected reports. You will see the reports are grouped by reporting area with a “Current Term” and “Previous Term” option.
Yes. After you apply your filter, you will see a summary of your filter listed at the top of the screen with the word “Do” in the beginning. Clicking on this will change the word into a “Don’t” and show you the opposite of your selected filters.
In Student Navigator, users can search for a particular student name or student ID as well as to use the array of available student and special filters to create custom groups of students.
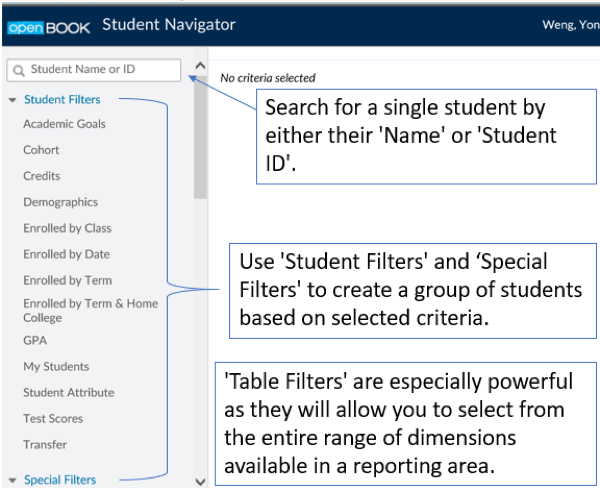
Student Navigator is used to find groups of individual students that share a common set of characteristics. Once a group of students has been identified, users can save the search criteria or the actual list of students for future use and even generate reports based off of this group.
Yes, click on the data point link and select the option to download the student data or save it as criteria in Student Navigator.
Click the “Download” link from the report toolbar.
![]()
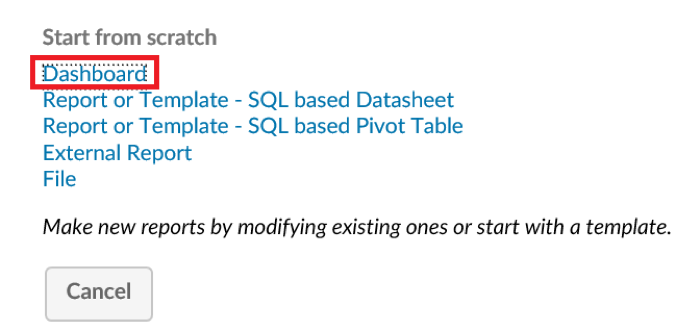
From the report list, click the “New” link from the top right-hand corner, select “Dashboard”. Click “Pick a Report” link to load the report in dashboard.

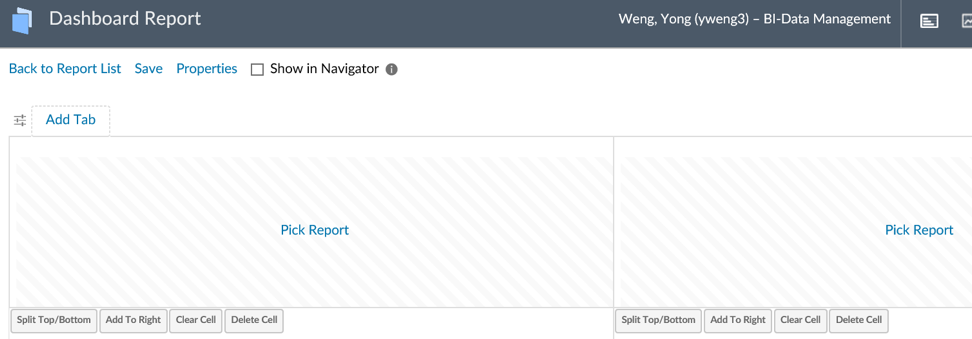
Yes, select the “Show in Navigator” checkbox then click “Save”. Now it is available in the Student Navigator dropdown menu.

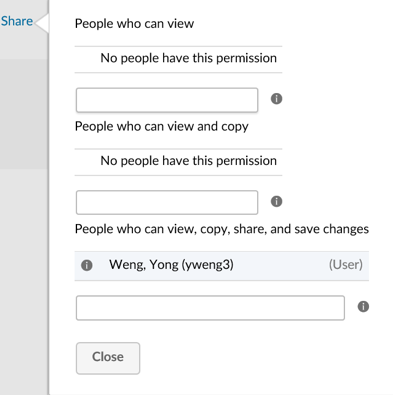
Click “Share” link from the toolbar. Enter user’s name in the textbox based on their needs.
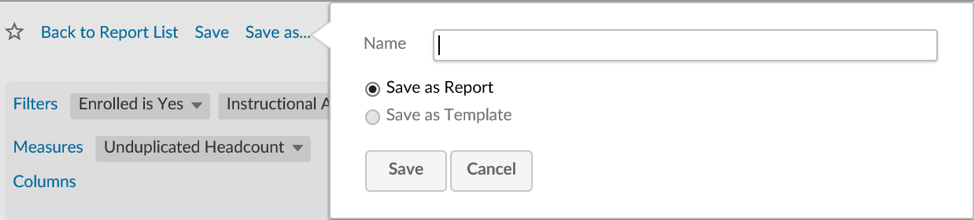
Click “Save as…” link and save your new report.
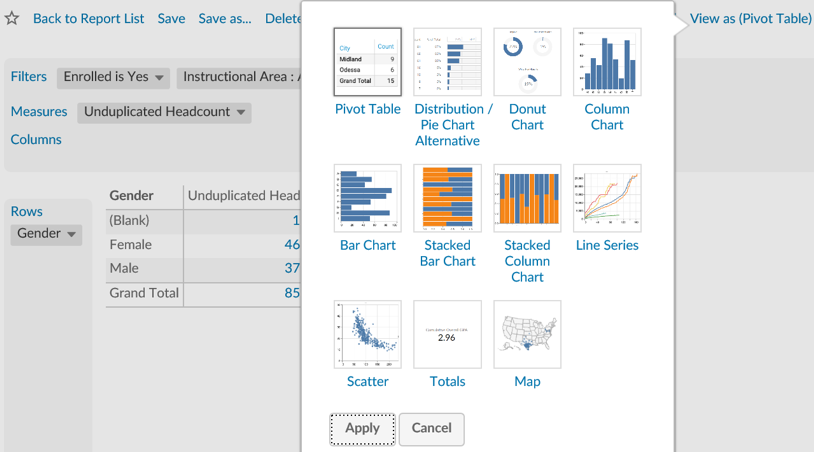
Within the report toolbar, click “View as (Pivot Table)” link and select a graph type then click “Apply”.
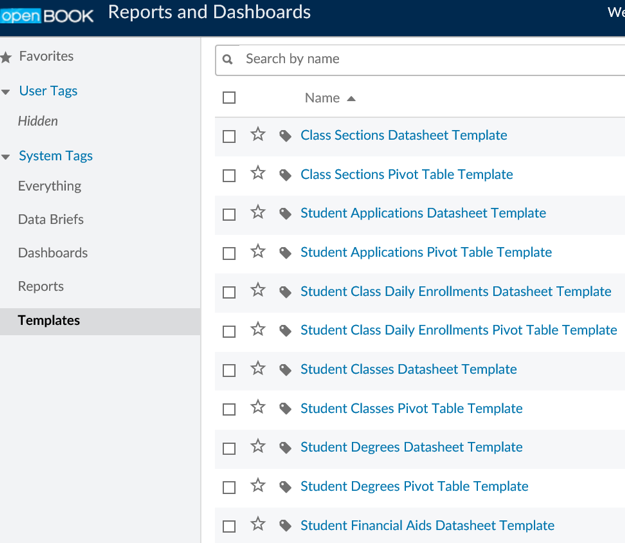
Yes. When looking at the report list, you’ll see a link in the left-hand navigation area called “Templates”. Click on one of the templates to create your own report and save it.
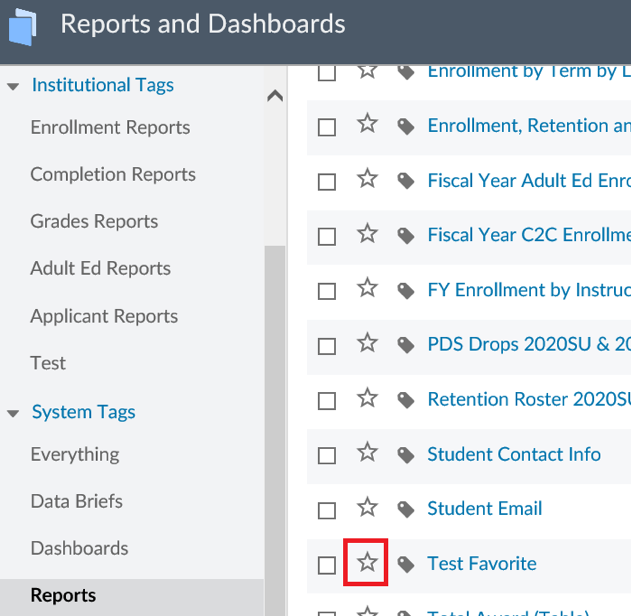
Once the report is created and saved, you can either click on the empty star icon within the report or on the report list to add to the favorite. When looking at the list of reports, you’ll see your favorites link in the top left navigation area.

Click on the “Back to Report List” link from the toolbar without saving it and select “Leave this page” on the pop-up window.

Simply click on any of the r filters, measures, columns, or rows then click “Remove”.

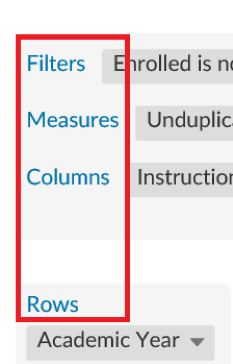
Simply click on the either measures, filters, columns, or rows and select the item you want to add. The screenshot below is for adding a filter. Select the filter you want to add and click the “Apply” button.

Within the report, click on the “Filters”, “Measures”, “Columns” or “Rows” to display a list of field list.
In each report of OpenBook’s “Reports and Dashboards”, click the “Filter”, “Measure”, “Column” or “Row” link and select a value, the data dictionary will be displayed in the right panel.
You can also view the Data Dictionary by clicking on the “Data Dictionary” link from the home page of OpenBook.
Dimensions are what you use to ‘slice and dice”, or divide, your measures into finer subcomponents. Some dimensions exist in many reporting areas (e.g., Gender, Ethnicity) and some exist only in a single reporting area (e.g., Awarded Program).
Use the Data Dictionary to learn more dimension definitions and possible values within the dimension.
Measures are basically numbers – Measures are data fields that can be counted or calculated such as “unduplicated headcount”, “Credits Attempted” or “GPA”. Measures can only be used in the main body of a report (as opposed to a filter, row field, or column field).
Reports are based on a specific ‘reporting area’. Reporting areas are selections of data which are driven by the user’s research question(s) or data interests. For example, if the question is about students and the classes in which they were enrolled, then it would be most appropriate to select “Student Classes” as the reporting area for the analysis. Similarly, for students and the degrees they were awarded, “Student Degrees “would be most helpful and “Student Tests” for questions around placement tests that students have taken. Below are the reporting areas available within OpenBook:
- Class Sections: Classes and related sections
- Student Classes: Students and the classes in which they enrolled
- Student Degrees: Students and the degrees with which they have been awarded
- Student Terms: Students and the terms in which they were enrolled
- Student Tests: Students and the placement tests they have taken
- Students: Biographic and demographic student data
OpenBook is accessible from any computer connected to a CCC network (please consult network policies regarding the use of personal computers on a CCC network prior to doing so).
You should login to OpenBook using your standard CCC-issued username and password as follows:
Username: jdoe
Password: [your password]
There is no need to add @ccc.edu to your username.
OpenBook is compatible with most browsers (e.g.,Chrome, Firefox, Safari) For previous OpenBook versions, Internet Explorer was required to access Enterprise Reports. With the upgrade to OpenBook v.8.4 and the new “Reports and Dashboards” functionality, this is no longer required.
Reports and Dashboards is the newest OpenBook reporting and visualization functionality replacing Enterprise reports. This improved functionality doesn’t require Internet Explorer to display visualizations. It also works with all popular browsers (e.g., Chrome, Firefox, and Safari). The Reports and Dashboards provides improved visualizations.
OpenBook is updated each night from the PeopleSoft Student Administration system (CS9) in order to be sure that is reflective of the most recent updates to the student records. National Student Clearinghouse (NSC) data is loaded five times per year within the following date ranges:
Between August 31st and September 15th
Between October 31st and November 10th
Between January 15th and February 1st
Between March 15th and March 31st
Between July 1st and July 10th
Currently, OpenBook pulls data from both the PeopleSoft Student Administration system (CS9) and the National Student Clearinghouse (NSC).
OpenBook can be accessed by going to https://openbook.ccc.edu any time that you are connected to a CCC network. If working remotely, you must be connected to VPN Pro.
OpenBook is CCC’s web-based data and reporting system. It can be used by faculty, staff and administrators to query data, run reports, and conduct analyses on CCC student data populations.